"Do income and happiness tend to go together? The visualization below shows that the answer to this question is yes, both within and across countries.
It may take a minute to wrap your head around this visualization, but once you do, you can see that it handily condenses the key information from the previous three charts into one.
To show the income-happiness correlation across countries, the chart below plots the relationship between self-reported life satisfaction on the vertical axis and GDP per capita on the horizontal axis. Each country is an arrow on the grid, and the location of the arrow tells us the corresponding combination of average income and average happiness.
To show the income-happiness correlation within countries, each arrow has a slope corresponding to the correlation between household incomes and self-reported life satisfaction within that country. In other words: the slope of the arrow shows how strong the relationship between income and life satisfaction is within that country. (This chart gives you a visual example of how the arrows were constructed for each country). 10
If an arrow points northeast, that means richer people tend to report higher life satisfaction than poorer people in the same country. If an arrow is flat (i.e. points east), that means rich people are on average just as happy as poorer people in the same country.
As we can see, there is a very clear pattern: richer countries tend to be happier than poorer countries (observations are lined up around an upward-sloping trend), and richer people within countries tend to be happier than poorer people in the same countries (arrows are consistently pointing northeast).
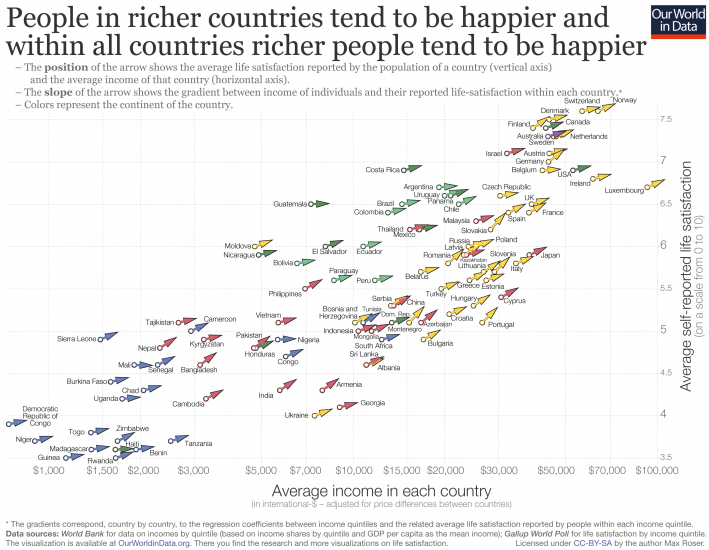
It’s important to note that the horizontal axis is measured in a logarithmic scale. The cross-country relationship we would observe in a linear scale would be different, since at high national income levels, slightly higher national incomes are associated with a smaller increase in average happiness than at low levels of national incomes. In other words, the cross-country relationship between income and happiness is not linear on income (it is ‘log-linear’). We use the logarithmic scale to highlight two key facts: (i) at no point in the global income distribution is the relationship flat; and (ii) a doubling of the average income is associated with roughly the same increase in the reported life-satisfaction, irrespective of the position in the global distribution.
These findings have been explored in more detail in a number of recent academic studies. Importantly, the much-cited paper by Stevenson and Wolfers (2008)11 shows that these correlations hold even after controlling for various country characteristics such as demographic composition of the population, and are robust to different sources of data and types of subjective well-being measures.
Economic growth and happiness
In the charts above we show that there is robust evidence of a strong correlation between income and happiness across and within countries at fixed points in time. Here we want to show that, while less strong, there is also a correlation between income and happiness across time. Or, put differently, as countries get richer, the population tends to report higher average life satisfaction.
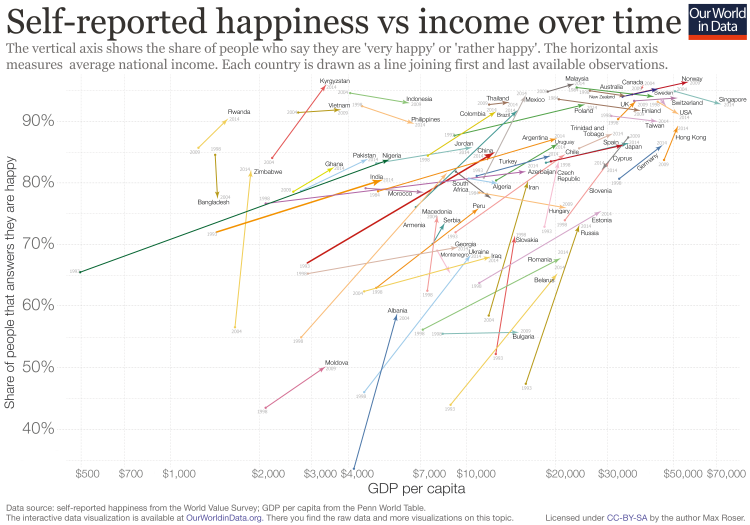
The following chart uses data from the World Value Survey to plot the evolution of national average incomes and national average happiness over time. To be specific, this chart shows the share of people who say they are ‘very happy’ or ‘rather happy’ in the World Value Survey (vertical axis), against GDP per head (horizontal axis). Each country is drawn as a line joining first and last available observations across all survey waves.12
As we can see, countries that experience economic growth also tend to experience happiness growth across waves in the World Value Survey. And this is a correlation that holds after controlling for other factors that also change over time (in this chart from Stevenson and Wolfers (2008) you can see how changes in GDP per capita compare to changes in life satisfaction after accounting for changes in demographic composition and other variables).
An important point to note here is that economic growth and happiness growth tend to go together on average. Some countries in some periods experience economic growth without increasing happiness. The experience of the US in recent decades is a case in point. These instances may seem paradoxical given the evidence—we explore this question in the following section.
The Easterlin Paradox
The observation that economic growth does not always go together with increasing life satisfaction was first made by Richard Easterlin in the 1970s. Since then, there has been much discussion over what came to be known as the ‘Easterlin Paradox’.
At the heart of the paradox was the fact that richer countries tend to have higher self-reported happiness, yet in some countries for which repeated surveys were available over the course of the 1970s, happiness was not increasing with rising national incomes. This combination of empirical findings was paradoxical because the cross-country evidence (countries with higher incomes tended to have higher self-reported happiness) did not, in some cases, fit the evidence over time (countries seemed not to get happier as national incomes increased).
Notably, Easterlin and other researchers relied on data from the US and Japan to support this seemingly perplexing observation. If we look closely at the data underpinning the trends in these two countries, however, these cases are not in fact paradoxical.
Let us begin with the case of Japan. There, the earliest available data on self-reported life satisfaction came from the so-called ‘Life in Nation surveys’, which date back to 1958. At first glance, this source suggests that mean life satisfaction remained flat over a period of spectacular economic growth (see for example this chart from Easterlin and Angelescu 2011).13 Digging a bit deeper, however, we find that things are more complex.
Stevenson and Wolfers (2008)14 show that the life satisfaction questions in the ‘Life in Nation surveys’ changed over time, making it difficult—if not impossible—to track changes in happiness over the full period. The visualization below splits the life satisfaction data from the surveys into sub-periods where the questions remained constant. As we can see, the data is not supportive of a paradox: the correlation between GDP and happiness growth in Japan is positive within comparable survey periods. The reason for the alleged paradox is in fact mismeasurement of how happiness changed over time.
In the US, the explanation is different, but can once again be traced to the underlying data. Specifically, if we look more closely at economic growth in the US over the recent decades, one fact looms large: growth has not benefitted the majority of people. Income inequality in the US is exceptionally high and has been on the rise in the last four decades, with incomes for the median household growing much more slowly than incomes for the top 10%. As a result, trends in aggregate life satisfaction should not be seen as paradoxical: the income and standard of living of the typical US citizen has not grown much in the last couple of decades. (You can read more about this in our entry on inequality and incomes across the distribution.)
"
Thursday, August 24, 2017
Do income and happiness tend to go together? Yes, both within and across countries
See Happiness and Life Satisfaction by Esteban Ortiz-Ospina and Max Roser.
 "
"
Subscribe to:
Post Comments (Atom)
2 comments:
Is there a negative correlation between happiness and suicide rates? I was reading an article illustrating this point. It mentions New York as ranking low in happiness but also low the amount of suicides.
https://bamituniabamu.wordpress.com/2013/05/31/developed-countries-and-its-love-for-suicide-a-paradox-yet-unexplained/
Kurt
Thanks for posting that link. That was a very interesting article. I sure don't have any explanation. It seems like as you get happier, the suicide rate should go down. But from what the article says, that may not be the case and "happier" societies might have higher rates.
Cy
Post a Comment